Search This Blog

Wednesday, December 26, 2012

The Search Marketing Roller Coaster: 2012 Year in Review


Well, 2012 has been one of hell a ride for the search marketer. The only way to describe it is a series of ups and downs, thrills and spills, twists and turns. It has been a roller coaster of a year.
Regardless of your type of business, practices, and online discipline the convergence of so many forms of marketing, technical change, increased local and mobile adoption and fusion of big data has had an impact on everyone in the industry.
Over the next couple of weeks, some of the top expert from SEW will share insights, yearly reviews, and tips on SEO, PPC, social, local and mobile as we enter 2013. As a prĂ©cis to that – today I wanted to give you an overview of the key changes the industry has faced in 2012 and share my list of top articles that highlight change throughout 2012.
2012-search-roller-coaster

Cause and Consequence

2012 started with the continued growth of search with the North American SEM industry projected to grow by to $23 billion over the year.
Search grew and Google changed. Google changed the way that people find information in search. Like it or not, it has changed the way that the search industry operates. No matter what your viewpoint or angle, there is always a cause and a consequence – a theme you'll notice recurring throughout this post.

It’s Only Natural to Start With Google and SEO

Google’s pursuit for relevancy really kick started the year as Google Search Plus Your World launched to solve issues regarding trust and authority of content by adding people, pages, and profiles that are all also fully integrated in search results.
Updates such as Caffeine and Google Panda reduced rankings for low quality sites and improved rankings for sites with great, innovation, and insightful content. Penguin then came along and cleaned up web spam and tried to put an end to black hat practices.
Google’s SSL changes meant that ‘not provided’ accounted for up to 24 percent of search traffic. The industry reacted and concerns about negative SEO and spammy backlink profiles became prominent. Google and Bing then introduced “Disavow Links” tools into their Webmaster Tools sets.
Google continued its clamp down of third party tools that 'scrape data' from Google. For many this signified a tipping point and choice between scraping or having access to the Google adwords API. The irony that Google itself scrape the web was not lost on many. However, the reality is that Google once again has forced the hand of many SEOs and in particular tool providers.
http://searchenginewatch.com/article/2232619/The-Search-Marketing-Roller-Coaster-2012-Year-in-Review?utm_source=twitterfeed&utm_medium=twitter

Infographic: Biggest Social Media Moments of 2012


Facebook TimelineSOPAKONY and U.S. President Barack Obama's re-election were just some of the big social-media stories of 2012.
This year, we also saw Pinterest emerge as one of the top social networks, Facebook CEOMark Zuckerberg became the center of media attention after the social network finally went public.
Social media is no longer a trend, but a way of life, according to an infographic by The SEO Company and Nowsourcing. In fact, people spend 121 billion minutes on social media -- and that's just in the U.S. alone, the infographic reveals.
To see what else happened in the social world this year, check out "The State of Social Media 2012," below:
http://mashable.com/2012/12/23/social-media-2012/?utm_medium=email

Wednesday, December 19, 2012

Consumer confidence rises in Indonesia

JAKARTA: Consumer confidence levels have reached a new high in Indonesia, buoyed by the country's relative economic strength, according to a report.

Drawing on interviews with 2,068 consumers across Indonesia, the regular KADIN-Roy Morgan barometer of popular perceptions climbed by 3.9 points month on month in November to 154.5 points.

This constituted a record high since the consumer poll began in 2005, and also marked an increase of 9.3 points on an annual basis, as figures stood at 145.2 points in November 2011.

In keeping with this trend, fully 92% of the panel thought the Asian nation was likely to experience "good times" economically during the coming five years, up four percentage points month on month

Another 82% believed this statement would hold true for the next 12 months, a reading which constituted an improvement of two points compared with the results from October 2012.

Equally, a 67% majority of Indonesians expected their family to be "better off" this time next year, a figure that stayed largely flat, and 42% were more prosperous than at the corresponding point in 2011.

Only 10% felt their family was "worse off" than in the penultimate month of 2011, with most of this group representing the poorest sections of society.

When discussing purchase intent, a 61% majority of interviewees adopted the position that "now is a good time to buy" major household items, also a new peak having grown by three points.

Among the "main income earners" with monthly salaries falling below RP1m ($104), however, this total fell to 34%, indicating that key differences remain within the broadly favourable findings.

"Spare a thought for them, Indonesia's under-privileged, who continue to do it tough each month," said Debnath Guharoy, the regional director for Asia at Roy Morgan research.

"These are the extended families, with multiple earners helping several generations under the same roof eke out an existence. For them, it is never a good time to buy a big-ticket item for the home." 

Data sourced from Jakarta Post; additional content by Warc staff, 19 December 2012
http://www.warc.com/LatestNews/News/Consumer_confidence_rises_in_Indonesia.news?ID=30788

Tuesday, December 18, 2012

Asia-Pacific to Top Western Europe Social Network Ad Spend in 2013


Asia-Pacific social ad spending will grow faster than North America or Western Europe

The Asia-Pacific region has a massive social network user base and a broad landscape of social networks for marketers to work with. From social sites such as Tencent Qzone and Sina Weibo in China to the increasing popularity of Facebook and Twitter in countries like Japan, India and Indonesia, the options are extensive.

With such enormous potential, increased monetization efforts in the region by Chinese and other Asian social networks will boost social network ad spending in Asia-Pacific, according to eMarketer estimates released in November. eMarketer predicts that spending in the region will rise 48% in 2013 and pass the $2 billion mark.

Japan and China, which have more sophisticated social network economies than other countries in the region, are helping to drive Asia-Pacific’s growth. Marketers there want to reach consumers who have shown a strong propensity to interact with brands on social media sites. According to a Q2 2012 InSites Consulting study, 66% of social network users in China and 56% of those in Japan followed a brand on a social media site—both greater than the US’s 53%.

Growth in social network ad spending in Asia-Pacific will be in the middle of the pack among the worldwide regions throughout the forecast, but rising faster than mature markets in North America and Western Europe, according to eMarketer estimates. That rise, aided by the enormous user base in the region, will help propel the Asia-Pacific region to take a 22.9% share of the worldwide total in 2013, just surpassing Western Europe’s 22.3% share. In 2014, that gap will widen to about a 3-percentage-point difference.

Nonetheless, spending per user is quite low in the region, attributable to the enormous user base of 616 million, as well as the fact that some Asia-Pacific countries, such as India and Indonesia, have immature digital advertising economies.

China, with the world’s largest social networking market, will have 307.5 million users by the end of 2012, eMarketer predicts, nearly double the US user base. In 2013, social network spend in China will reach $612.8 million. The market will experience rapid growth throughout the forecast period, including a 51.3% gain next year, just slightly faster than the anticipated regional rise of 48.3%.

Neither Facebook nor Twitter has an official presence there, though, leaving marketers’ advertising spend to collect among homegrown networks such as Sina Weibo, Renren and Tencent’s various social platforms.

http://www.emarketer.com/(S(gjrgkh45dmewndatycqrprnz))/Article.aspx?R=1009545

Monday, December 17, 2012

Social Media: The Newest Designer Drug


This just in: People really like using social media to interact. Oh wait, you probably already knew that. In fact, you're probably one of those people.
To put it in perspective, there are about 7 billion people on the planet. Facebook signed up one billion users in slightly more than eight years of existence.
Have you ever wondered why these sites are so popular? As with any observable global phenomenon, scientists and researchers have been furiously trying to answer that very question. At first glance, some of the results seem shocking.
For instance, a survey conducted by the University of Chicago Booth School of Business concluded that resisting the urge to use social media is tougher than resisting the urge to sleep or have sex. Granted, there is often little reason to resist, because it takes minimal effort to check Facebook or Twitter.
However, there appear to be physiological forces driving social media use. According to Harvard University research, self-disclosure spurs the release of dopamine, a neurotransmitter associated with rewarding feelings. The same study cites research that found 80% of social media posts are self-reflective, compared to 30-40% of speech during verbal conversation.
So just like Twizzlers "make mouths happy," Twitter makes brains happy.
The infographic below, created by Online College Courses, summarizes some of the shocking findings about the addictive nature of social media usage.
Are we actually crazy for social media, or are there lurking variables at play? Continue the discussion in the comments section below.
This Is Your Brain On Social Media
Image courtesy of Flickr, Toca Boca
http://mashable.com/2012/12/15/social-media-brain/?utam_medium=feed&utm_source=feedburner&utm_campaign=Feed%3A+Mashable%2FSocialMedia+%28Mashable+»+Social+Media+Feed%29

Friday, December 14, 2012

Advertising to the Generations When X Doesn't Meet Y


xy1
Have you ever tried to explain how Facebook works to a person over the age of 75? Or what a rotary phone is to a person under the age of 20? There are huge differences between the generations that brands aim to reach today, and some of those differences present problems for advertisers and the agencies that represent them.
Who Makes Up Each Generation?
Counting the oldest consumers down to the youngest, there are 6 generations to be taken into account:
Pre-Depression Generation - Pre-1930
Silent Generation - 1930-1945
Baby Boomers - 1946-1964
Generation X - 1965-1977
Generation Y - 1977-1994
Generation Z - 1995-Present
Of course, some products are marketed specifically to one or two of the generations, making it easier to craft an appropriate message. It’s unlikely, for example, that members of Generation Y will be the target of an advertising campaign for a product like Rogaine, or that members of the Pre-Depression Generation would have a need for iPods.
Sometimes, though, brands do have a need to reach multiple generations. Ads for toys are often directed at Generation Z, but their parents probably have the final say in whether or not an item is purchased. At the other end of the spectrum, a retirement home must appeal to both the person who will be living there, and those that take care of that person.
There are lots of products used by multiple generations, too. Food, for instance, is consumed by all generations — especially things like canned soup. How do you create a brand message that reaches and appeals to everyone from great-grandparents to little children?
Where Is Your Target Advertising Audience?
From print to text messaging, there are wide differences in preferences across the generations, and the advertising method used to communicate brands’ messages is almost as important as how those messages are put together. A large, beautiful print ad directed at Gen Xers is not as likely to be successful as a similar ad directed at the Silent Generation. Choosing the correct platform can be the best way to create a successful campaign.
The Pre-Depression Generation is likely to give more credence to information in print. They also watch television, but regard information in print as more reliable. Direct mail is a good bet, but an internet ad campaign probably won’t work as well.
Print works well for the Silent Generation as well, but they also have a higher regard for information they see and hear on the television. While radio advertising is unlikely to reach the three youngest generations, it may work well for these folks.
The majority of Baby Boomers are computer literate, and therefore are the first generation most likely to be reached through that medium. They also watch TV, still listen to the radio, and pay attention to print. For Baby Boomers, the advertising method used to reach them is less important than how the message is crafted.
Generation X watches less network television than previous generations, and is less likely to listen to traditional radio. In fact, Gen Xers are notoriously hard to reach, and when brands are successful in reaching them, those messages are met with a high level of suspicion.  They do tend to have a high regard for peer recommendations, so social media offers one avenue for marketing to them.
As the first generation to grow up with constant access to the internet, technology is the key to reaching Generation Y. Print, network television and traditional radio advertisements are not good ways to reach Gen Y, but text messaging, internet marketing, and cable are viable methods.
The youngest consumers of all are members of Generation Z, and they are the most steeped in technology, particularly of the wireless variety. Gen Z watches lots of cable TV, and ads there do well. Many brands that are actually targeting an older demographic have discovered the power of the “kid influence.” Kids influence the purchases their parents make in many unexpected areas. Almost two-thirds of parents say that their children influence their automobile purchasing decision, for instance.
You Found the Audience. Now What?
Of course, choosing the best way to reach your target audience is only one piece of the advertising and marketing puzzle. The way the message is delivered is important, too, and the differences in how each generation reacts to various types of marketing are stark. The Silent Generation has a great deal of respect for authority figures, so expert recommendations are important to them. However, the same recommendations are likely to fall flat with Gen X, which has a notorious disrespect for authority.
Marketing the same product to multiple generations presents a complex challenge. Each generation is uniquely impacted by the previous generation, major global events, economic upheaval or success, politics and social change, as well as many other factors. Finding what types of advertisements (and placements) appeal to the target demographic, as well as what repels them, will help agencies and brands communicate marketing messages clearly and successfully.

Wednesday, December 12, 2012

2012 Internet and Mobile Trends (Infographic)

The Internet has opened up a whole new world of connectivity on an international scale and the trend only strengthened through 2012.


http://holykaw.alltop.com/2012-internet-and-mobile-trends-infographic?tu2=1

The Imminent Mobile Commerce Avalanche

Mobile devices have become a ubiquitous shopping accessory, whether for checking competitive prices on Amazon while in the store (i.e. “showrooming”) or seamlessly purchasing on your iPad from the comfort of your couch, known as sit-back shopping. While it may come as no surprise to many of you, there are a variety of trends that point towards a coming avalanche of mobile influence and spending as consumer behavior, marketers, and technology converge to create a perfect shopping storm.

Due to a past felony I must have committed during my early life, my karmic payback was having to go out shopping on Black Friday this year. After almost committing seppuku, I accepted my fate and hunkered down for a day of hip checks and raised blood pressure.  As annoying as the crowds were, my experience (and savings) was positively impacted by a trusty sidekick: my smartphone.
Smartphone & Tablet Adoption Still Haven’t Peaked
Walking around a big city it would seem that everyone has a smartphone. The familiar image of someone typing with both hands in front of them immediately denotes a smartphone user, but believe it or not, not everyone in the U.S. is walking around with an iPhone in their hand.
According to our latest figures, only 53% of all cell phone owners in the U.S. have smartphones as their primary device. With 234 Million total cell phone owners in the U.S. (age 13+), comScore MobiLens® shows that over 110 Million cell phone users that have yet to migrate over from their feature phones. Well over 50% of new handset purchases are smartphones, which means that market penetration will continue to ascend for the foreseeable future.
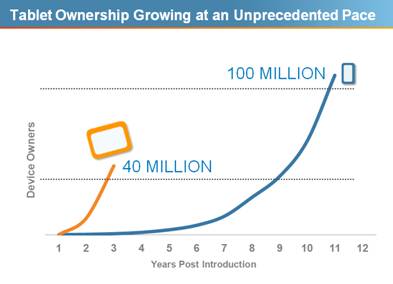
Tablets saw a meteoric rise these past three years, reaching 40 Million units in the United States seemingly overnight while it took smartphones about nine years to reach a similar level. With all of the options available, adoption will continue at breakneck speed, but as noted above, there is still a long way to go before we hit saturation.
Tablet Ownership Growing at an Unprecedented Pace
While both devices are driving this huge shift in consumption towards mobile, we should also acknowledge that as different devices, they assume a very different role in the digital shopping experience. Specifically, smartphones disrupt the traditional brick-and-mortar purchase process but don’t necessarily result in direct conversion, while tablets are more often used at home – often in the evening hours – and result in more transactions.
Mobile Purchase May Be Ready to Accelerate
There’s no doubt that people love the convenience, comfort and attractive pricing that digital commerce affords. But their mobile purchasing activity hasn’t yet caught up to their overall usage of these new media. In fact, it’s only begun to represent a meaningful percentage of total e-commerce activity in the past two years.
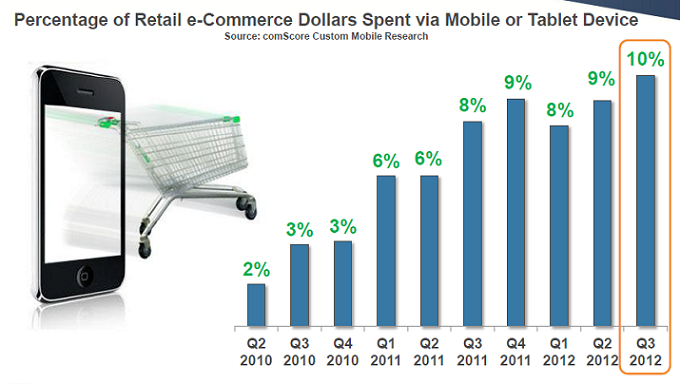
According to comScore e-commerce research, 10% of online retail dollars spent in Q3 2012 were on mobile devices. We anticipate this share to increase to an even more substantial 12-13% during Q4 2012. Tablets are the driving force behind this transaction share explosion, as the ease of use and shopping experience on a tablet device lends itself rather well to actual purchase behavior and more closely approximates the desktop buying experience than smartphones. In fact, the mobile spending trend acceleration appears to coincide with the more mainstream adoption of tablets in 2011.

Percentage of Retail e-Commerce Dollars Spent via Mobile or Tablet Device
As rapid device adoption continues, not only are more consumers entering the m-commerce market, but those who may have first entered a year or two ago are integrating more advanced behaviors into their mobile repertoire. Last year’s first-time smartphone owner is this year’s first-time showroomer and maybe next year’s first-time dabbler in tablet commerce. Continued technology and marketing investment are creating a mobile shopping environment that is increasingly easy to use and highly functional, enabling the consumer to learn and adopt these new behaviors more quickly.
Device adoption is a snowball picking up size and speed, but the tipping point will be when the average mobile consumer is comfortable shopping, showrooming and purchasing over their smartphones and tablets. Retailers must now prepare for the coming avalanche…or risk getting buried by it.
http://www.comscore.com/Insights/Blog/The_Imminent_Mobile_Commerce_Avalanche?utm_source=feedburner&utm_medium=feed&utm_campaign=Feed%3A+comscoreblog+%28comScore+Voices%29

Monday, December 10, 2012

Watching TV? Don’t Forget Your Smartphone, Tablet

Tablets and smartphones have quickly become a technological staple of the modern family. While smartphone penetration in the U.S. is over 50 percent, tablet penetration is on the fast track as well. Within a two-year period, almost one fifth of U.S. homes have become tablet owners, according to Nielsen’s most recent Cross Platform Report. Though tablet owners tend to be older and more affluent than smartphone owners, it only proves that the adoption and use of new technologies are not reserved for the young.


What’s more is that tablets have forded the oft-treacherous age gap. Thirty-six percent of people age 35-54 years old and 44 percent of people 55-64 years old use their tablets while watching TV in order to dive deeper into programming. Nearly a third of tablet users age 25-64 check sports scores while watching games too. In fact, a majority of owners use apps while watching TV across the board.
A small digital divide between the sexes has been happening with smartphones, however. Over 40 percent of female smartphone owners use their smartphones at least once a day while watching TV. Men, one the other hand, use their smartphones much less. About 35 percent say they put their smartphones in use while channel surfing, giving new meaning to the phrase “pass the remote.”

http://blog.nielsen.com/nielsenwire/consumer/watching-tv-dont-forget-your-smartphone-tablet/

Friday, December 7, 2012

Is Advertising a Good Investment During a Downed Economy?


advertisingstrategy
Whenever the economy goes south, consumers naturally tighten their budgets and reduce spending on most goods and services across the board. This would indicate in just about every facet that advertising budgets would drop, too. But in the last recession, many large corporations opted to increase their advertising budget heading into the downed economy. Kraft, Procter & Gamble, and Kellogg are among the big names of big spenders that decided a downed economy could be a good reason to increase ad spending.
One of the main decisions behind the decision by these big companies to increase ad spending during a recession is hidden in a 2004 report published by the American Association of Advertising. The report said that advertising generally has an outcome on financial success for up to three years following the initial investment. Combining that with the fact that the report found increased spending during a down economy usually reaps bigger rewards than increased spending during a good economy, you are able to find the reasoning that these big advertisers had.
One reason that increased advertising during a recession is a good investment is that doing essentially paints the company as “strong” and durable to the recession. Not only does it work well in the eyes of the consumer, but employees too benefit from the idea that they’re working in a strong environment. It’s essentially being optimistic about the future, and company shareholders also recognize this.
Companies that decide to cut their advertising budget during a recession usually end up seeing the negative results in their stock prices. The decreased visibility, along with the increased visibility of their competitors, lets to the big spenders gaining a big chunk of market share.
If the economy causes an entire street of supermarkets to reduce hours, yet one supermarket opens early and closes late, it’s a no brainer that more and more customers will abandon their current supermarket for the stronger one. The same goes for companies that increase ad spending during a downed economy; they’re essentially filling the space left by other companies that have cut their advertising budgets, leading to increased visibility and likely higher market share and sales down the road. And don’t think once the economy recovers that customers will flock back to their old supermarket, because once they’ve switched brands they will have little motivation to switch back.
Companies that increase their advertising budget during a recession are smart if they adapt their message, too. During the last recession, we saw companies like Starbucks try and shift their message to reflect more value-oriented ideals. Starbucks, the home of the $5 coffee, tried advertising $1 coffees in certain markets.
Increasing ad spending during a recession is something done to reach long term goals, and it’s no secret that a good majority of companies wouldn’t be able to afford it. But the ones that do end up prospering. Finding investment books About Ken Fisher can help explain the idea of investing in a downed economy, as it usually is high-risk, high-reward.
By Shawn Hartley

Thursday, December 6, 2012

Social Media Report 2012: Social Media Comes of Age


Social media and social networking are no longer in their infancy. Social media continues to grow rapidly, offering global consumers new and meaningful ways to engage with the people, events and brands that matter to them.  According to Nielsen and NM Incite’s latest Social Media Report, consumers continue to spend more time on social networks than on any other category of sites—roughly 20 percent of their total time online via personal computer (PC), and 30 percent of total time online via mobile.  Additionally, total time spent on social media in the U.S. across PCs and mobile devices increased 37 percent to 121 billion minutes in July 2012, compared to 88 billion in July 2011.
The recent proliferation of mobile devices and connectivity helped fuel the continued growth of social media. While the computer remains as the predominant device for social media access, consumers’ time spent with social media on mobile apps and the mobile web has increased 63 percent in 2012, compared to the same period last year.
Facebook remains the top social network, but new social media sites continue to emerge and catch on.
Facebook remains the most-visited social network in the U.S. via PC (152.2 million visitors), mobile apps (78.4 million users) and mobile web (74.3 million visitors), and is multiple times the size of the next largest social site across each platform.  The site is also the top U.S. web brand in terms of time spent, as some 17 percent of time spent online via personal computer is on Facebook.
The number of social media networks from which consumers can choose has exploded, and countless sites are adding social features, or integrations. While Facebook and Twitter continue to be among the most popular social networks, Pinterest emerged as a one of the breakout stars in social media for 2012, boasting the largest year-over-year increase in both unique audience and time spent of any social network across PC, mobile web and apps.
For additional insights on consumers’ cross-platform social media usage and activities, view the complete State of the Media: The Social Media Report 2012.
http://blog.nielsen.com/nielsenwire/global/social-media-report-2012-social-media-comes-of-age/

Tuesday, December 4, 2012

Social Media Managers Going Gangnam Style

Less than six months after its July 15 release, “Gangnam Style” reached 1 billion views on YouTube and became the platform’s most-watched clip ever in late November. Social media managers for big brands across the world latched onto the Korean electronica dance hit’s international success, infusing their Facebook marketing with their own takes on the song’s video. Intel gained the most Facebook engagement, shows data shared first with Mashable from social media analysis company Unmetric. Intel’s Facebook photo post — featuring a man in an Intel shirt doing the “Gangnam Style” dance in a horse stable — has more than 500,000 Likes, 40,000 shares and 13,000 comments since Sept. 15.

Social Media Managers Going Gangnam Style
http://visual.ly/social-media-managers-going-gangnam-style

Monday, December 3, 2012

Ad Revenues To Grow In 2013


Regional - In 2012, media companies around the world saw their advertising revenues grow 3.8% to a total of US$479.9 billion, with that in Asia Pacific growing by an average 5.5% despite a slowdown in emerging Asia markets, especially China (9.2%) and India (2.6%).
This is according to Magna Global Advertising Forecast 2013, which forecasts media owners advertising revenues to grow 3.1% in 2013.
The study forecasts that in 2013, India's advertising growth will re-accelerate to 8.7% while Chinese advertising will grow 9.5% in 2013 before going back to double-digit growth starting from 2014. This is driven by two factors - a very low ad-per-capita ratio and the need for global advertisers to reach the rising middle classes.
Most other markets in Emerging Asia will experience explosive growth - Malaysia (+9.7%) and Vietnam (+13.4%).
On a global basis, 2013 will see an increase in ad revenues for out-of-home (including cinema) (by 3.4%) and radio (1.5%), while television and magazines will see a decrease by -3.4% and -4.3%, respectively.
Digital media will see the largest increase in revenue in 2013 with 13.5%, as more investment shifts towards online video and mobile-based formats and paid search (+14%).
"Marketers are gradually embracing the new marketing and branding opportunities: mobile advertising already represents US$6 billion globally, i.e. 6% of digital advertising and 1% of total advertising. This format will grow to US$24 billion by 2017, reaching 14% of global digital advertising and 4% of overall advertising revenues," said Vincent Letang, EVP, director of global forecasting and author of the report.

http://marketing-interactive.com/news/37112